Expo
view channel
view channel
view channel
view channel
view channel
view channel
view channel
RadiographyMRIUltrasoundNuclear Medicine
Imaging ITIndustry News
Events

- AI-Powered Imaging Technique Shows Promise in Evaluating Patients for PCI
- Higher Chest X-Ray Usage Catches Lung Cancer Earlier and Improves Survival
- AI-Powered Mammograms Predict Cardiovascular Risk
- Generative AI Model Significantly Reduces Chest X-Ray Reading Time
- AI-Powered Mammography Screening Boosts Cancer Detection in Single-Reader Settings
- Ultra-Powerful MRI Scans Enable Life-Changing Surgery in Treatment-Resistant Epileptic Patients
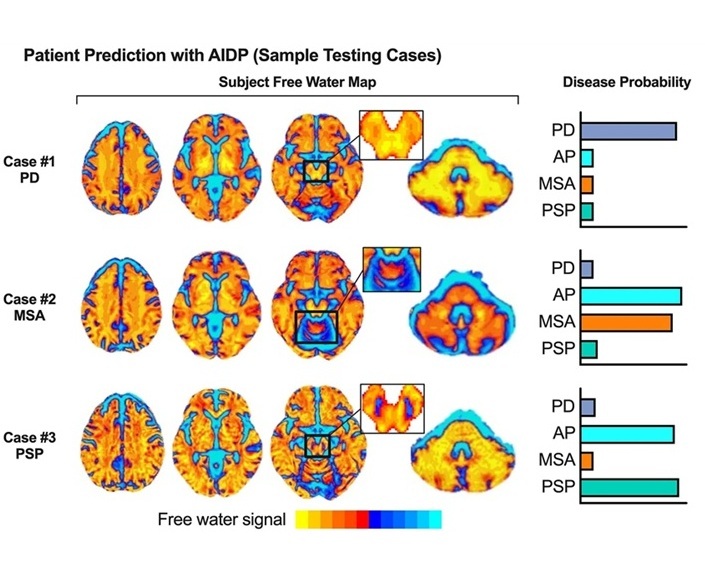
- AI-Powered MRI Technology Improves Parkinson’s Diagnoses
- Biparametric MRI Combined with AI Enhances Detection of Clinically Significant Prostate Cancer
- First-Of-Its-Kind AI-Driven Brain Imaging Platform to Better Guide Stroke Treatment Options
- New Model Improves Comparison of MRIs Taken at Different Institutions
- Novel PET Imaging Approach Offers Never-Before-Seen View of Neuroinflammation
- Novel Radiotracer Identifies Biomarker for Triple-Negative Breast Cancer
- Innovative PET Imaging Technique to Help Diagnose Neurodegeneration
- New Molecular Imaging Test to Improve Lung Cancer Diagnosis
- Novel PET Technique Visualizes Spinal Cord Injuries to Predict Recovery
- AI Identifies Heart Valve Disease from Common Imaging Test
- Novel Imaging Method Enables Early Diagnosis and Treatment Monitoring of Type 2 Diabetes
- Ultrasound-Based Microscopy Technique to Help Diagnose Small Vessel Diseases
- Smart Ultrasound-Activated Immune Cells Destroy Cancer Cells for Extended Periods
- Tiny Magnetic Robot Takes 3D Scans from Deep Within Body
- AI Model Significantly Enhances Low-Dose CT Capabilities
- Ultra-Low Dose CT Aids Pneumonia Diagnosis in Immunocompromised Patients
- AI Reduces CT Lung Cancer Screening Workload by Almost 80%
- Cutting-Edge Technology Combines Light and Sound for Real-Time Stroke Monitoring
- AI System Detects Subtle Changes in Series of Medical Images Over Time
- Global AI in Medical Diagnostics Market to Be Driven by Demand for Image Recognition in Radiology
- AI-Based Mammography Triage Software Helps Dramatically Improve Interpretation Process
- Artificial Intelligence (AI) Program Accurately Predicts Lung Cancer Risk from CT Images
- Image Management Platform Streamlines Treatment Plans
- AI Technology for Detecting Breast Cancer Receives CE Mark Approval
- Patient-Specific 3D-Printed Phantoms Transform CT Imaging
- Siemens and Sectra Collaborate on Enhancing Radiology Workflows
- Bracco Diagnostics and ColoWatch Partner to Expand Availability CRC Screening Tests Using Virtual Colonoscopy
- Mindray Partners with TeleRay to Streamline Ultrasound Delivery
- Philips and Medtronic Partner on Stroke Care

 Expo
Expo
- AI-Powered Imaging Technique Shows Promise in Evaluating Patients for PCI
- Higher Chest X-Ray Usage Catches Lung Cancer Earlier and Improves Survival
- AI-Powered Mammograms Predict Cardiovascular Risk
- Generative AI Model Significantly Reduces Chest X-Ray Reading Time
- AI-Powered Mammography Screening Boosts Cancer Detection in Single-Reader Settings
- Ultra-Powerful MRI Scans Enable Life-Changing Surgery in Treatment-Resistant Epileptic Patients
- AI-Powered MRI Technology Improves Parkinson’s Diagnoses
- Biparametric MRI Combined with AI Enhances Detection of Clinically Significant Prostate Cancer
- First-Of-Its-Kind AI-Driven Brain Imaging Platform to Better Guide Stroke Treatment Options
- New Model Improves Comparison of MRIs Taken at Different Institutions
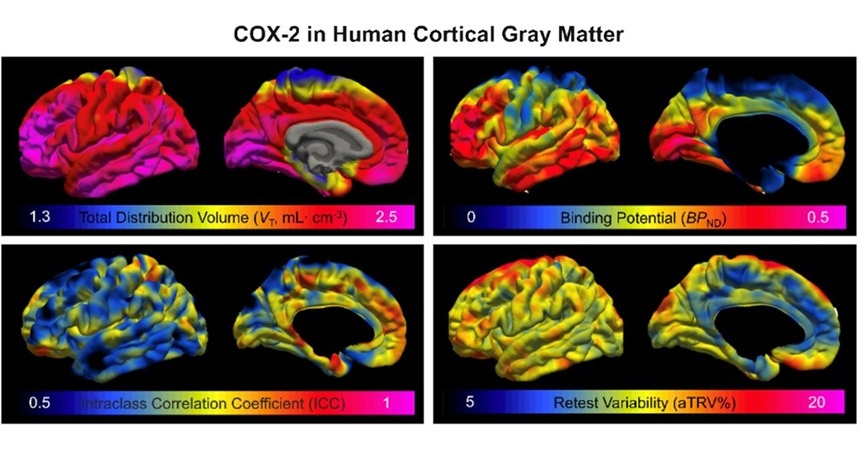
- Novel PET Imaging Approach Offers Never-Before-Seen View of Neuroinflammation
- Novel Radiotracer Identifies Biomarker for Triple-Negative Breast Cancer
- Innovative PET Imaging Technique to Help Diagnose Neurodegeneration
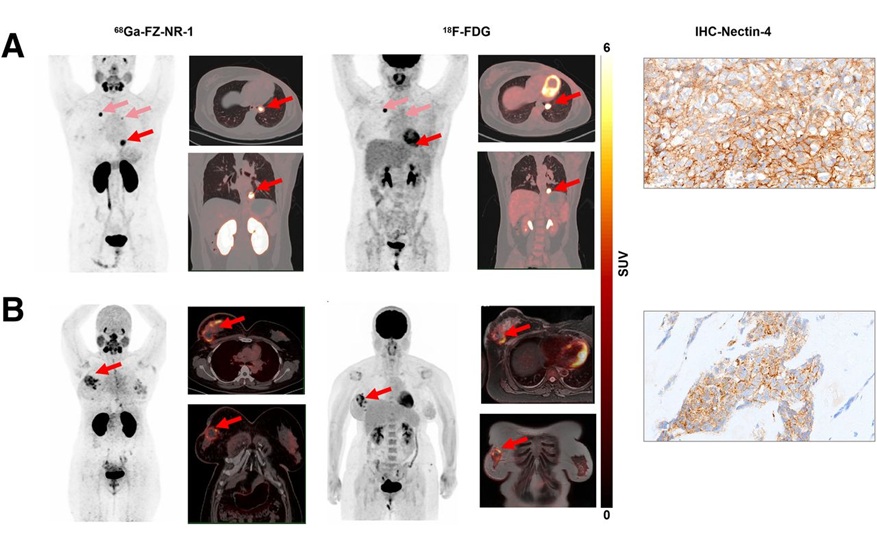
- New Molecular Imaging Test to Improve Lung Cancer Diagnosis
- Novel PET Technique Visualizes Spinal Cord Injuries to Predict Recovery
- AI Identifies Heart Valve Disease from Common Imaging Test
- Novel Imaging Method Enables Early Diagnosis and Treatment Monitoring of Type 2 Diabetes
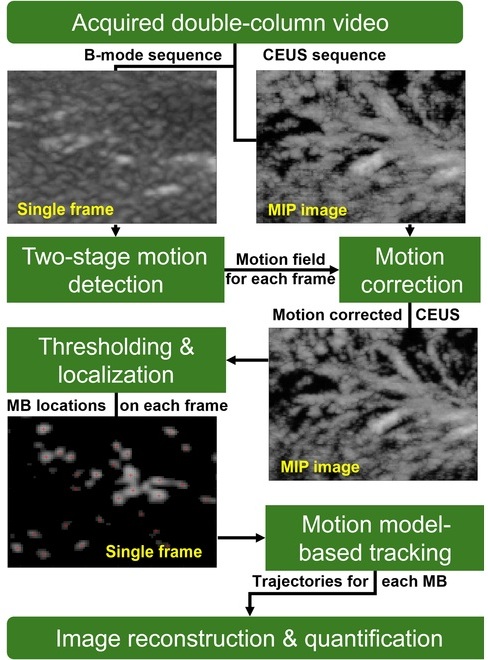
- Ultrasound-Based Microscopy Technique to Help Diagnose Small Vessel Diseases
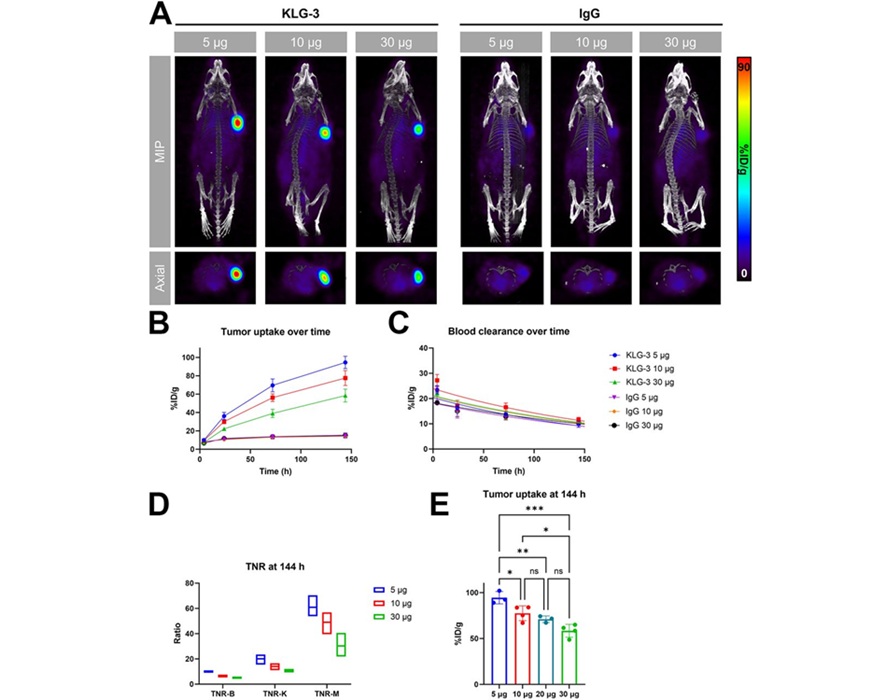
- Smart Ultrasound-Activated Immune Cells Destroy Cancer Cells for Extended Periods
- Tiny Magnetic Robot Takes 3D Scans from Deep Within Body
- AI Model Significantly Enhances Low-Dose CT Capabilities
- Ultra-Low Dose CT Aids Pneumonia Diagnosis in Immunocompromised Patients
- AI Reduces CT Lung Cancer Screening Workload by Almost 80%
- Cutting-Edge Technology Combines Light and Sound for Real-Time Stroke Monitoring
- AI System Detects Subtle Changes in Series of Medical Images Over Time
- Global AI in Medical Diagnostics Market to Be Driven by Demand for Image Recognition in Radiology
- AI-Based Mammography Triage Software Helps Dramatically Improve Interpretation Process
- Artificial Intelligence (AI) Program Accurately Predicts Lung Cancer Risk from CT Images
- Image Management Platform Streamlines Treatment Plans
- AI Technology for Detecting Breast Cancer Receives CE Mark Approval
- Patient-Specific 3D-Printed Phantoms Transform CT Imaging
- Siemens and Sectra Collaborate on Enhancing Radiology Workflows
- Bracco Diagnostics and ColoWatch Partner to Expand Availability CRC Screening Tests Using Virtual Colonoscopy
- Mindray Partners with TeleRay to Streamline Ultrasound Delivery
- Philips and Medtronic Partner on Stroke Care









 Guided Devices.jpg)



.jpeg)
